Teachers Are the Most At-Risk to COVID-19 in These States
This fall, many schools will reopen their doors to students — and to COVID-19.
The beginning of the school year is already in full swing in some states, and it’s just around the corner in many others. Despite the variation in opening dates among states, one factor remains constant: teachers across the country are concerned, not only for the wellbeing of their students but also for their own safety.
The White House has put pressure on schools to reopen this fall for in-person instruction, and teachers have been striking. Nationwide, from New York to Texas, teachers have not only pushed for proper safety measures as schools reopen during the pandemic, but others have even called for remote-only learning this fall. Teacher unions, including the American Federation of Teachers — one of the nation’s largest, representing nearly 2 million school employees — have provided their support. Other teachers, fearing for their safety, have begun resigning en masse. In Utah, for example, 79 teachers have already resigned or retired early as of August 21 in Salt Lake County alone, despite risking a $1,000 fine for doing so too close to the school year’s start date.
Teachers’ fears for their safety and for the safety of their students are not unfounded. Within the first few weeks of school districts reopening in states like Georgia or Tennessee, flare-ups of the virus among thousands of students have already forced schools to close or modify their schedule.
While some states have set stricter safety and social distancing measures in schools, many have not. Other factors that affect teachers’ safety also vary from state to state, including school funding, school crowding, teacher union strength and influence, and trends in COVID-19 case counts. The data science team at Insurify turned to a myriad of state-by-state statistics to determine the states with teacher populations that are at the highest risk during the pandemic.
Insights
- Regional differences. Based on composite scores calculated by Insurify’s data science team, there are significant differences in risk levels for teachers during the pandemic among Census Bureau-designated regions. Specifically, teachers are at most risk in Western states, which have scored the lowest in this analysis, at 7 percent below the national average of 82 points out of 100. The South scores second-lowest in the nation, at 4 percent below the national average, followed by the Midwest and Northeast, scoring 3 and 15 percent above the national average, respectively.
- States where teachers are the safest. Massachusetts’ teacher populations are at the least risk due to COVID-19, followed by Rhode Island, New Jersey, New York, and Connecticut. Commonalities among these five states are low rates of school crowding, above-average school funding per student, and better-than-average healthcare.
- Lack of school funding, overcrowding, and healthcare access significantly contribute to risk. In analyzing state-by-state data to create a composite score, the data science team at Insurify identified a few notable correlations. They discovered a strong negative correlation between public school funding and school overcrowding (Pearson’s r = -0.94). Public school funding is also strongly correlated with teacher union influence (Pearson’s r = 0.55) and moderately correlated with healthcare quality (Pearson’s r = 0.32). In brief, below-average public school funding is associated with overcrowding in schools, below-average teacher union influence, and below-average healthcare quality.
Methodology
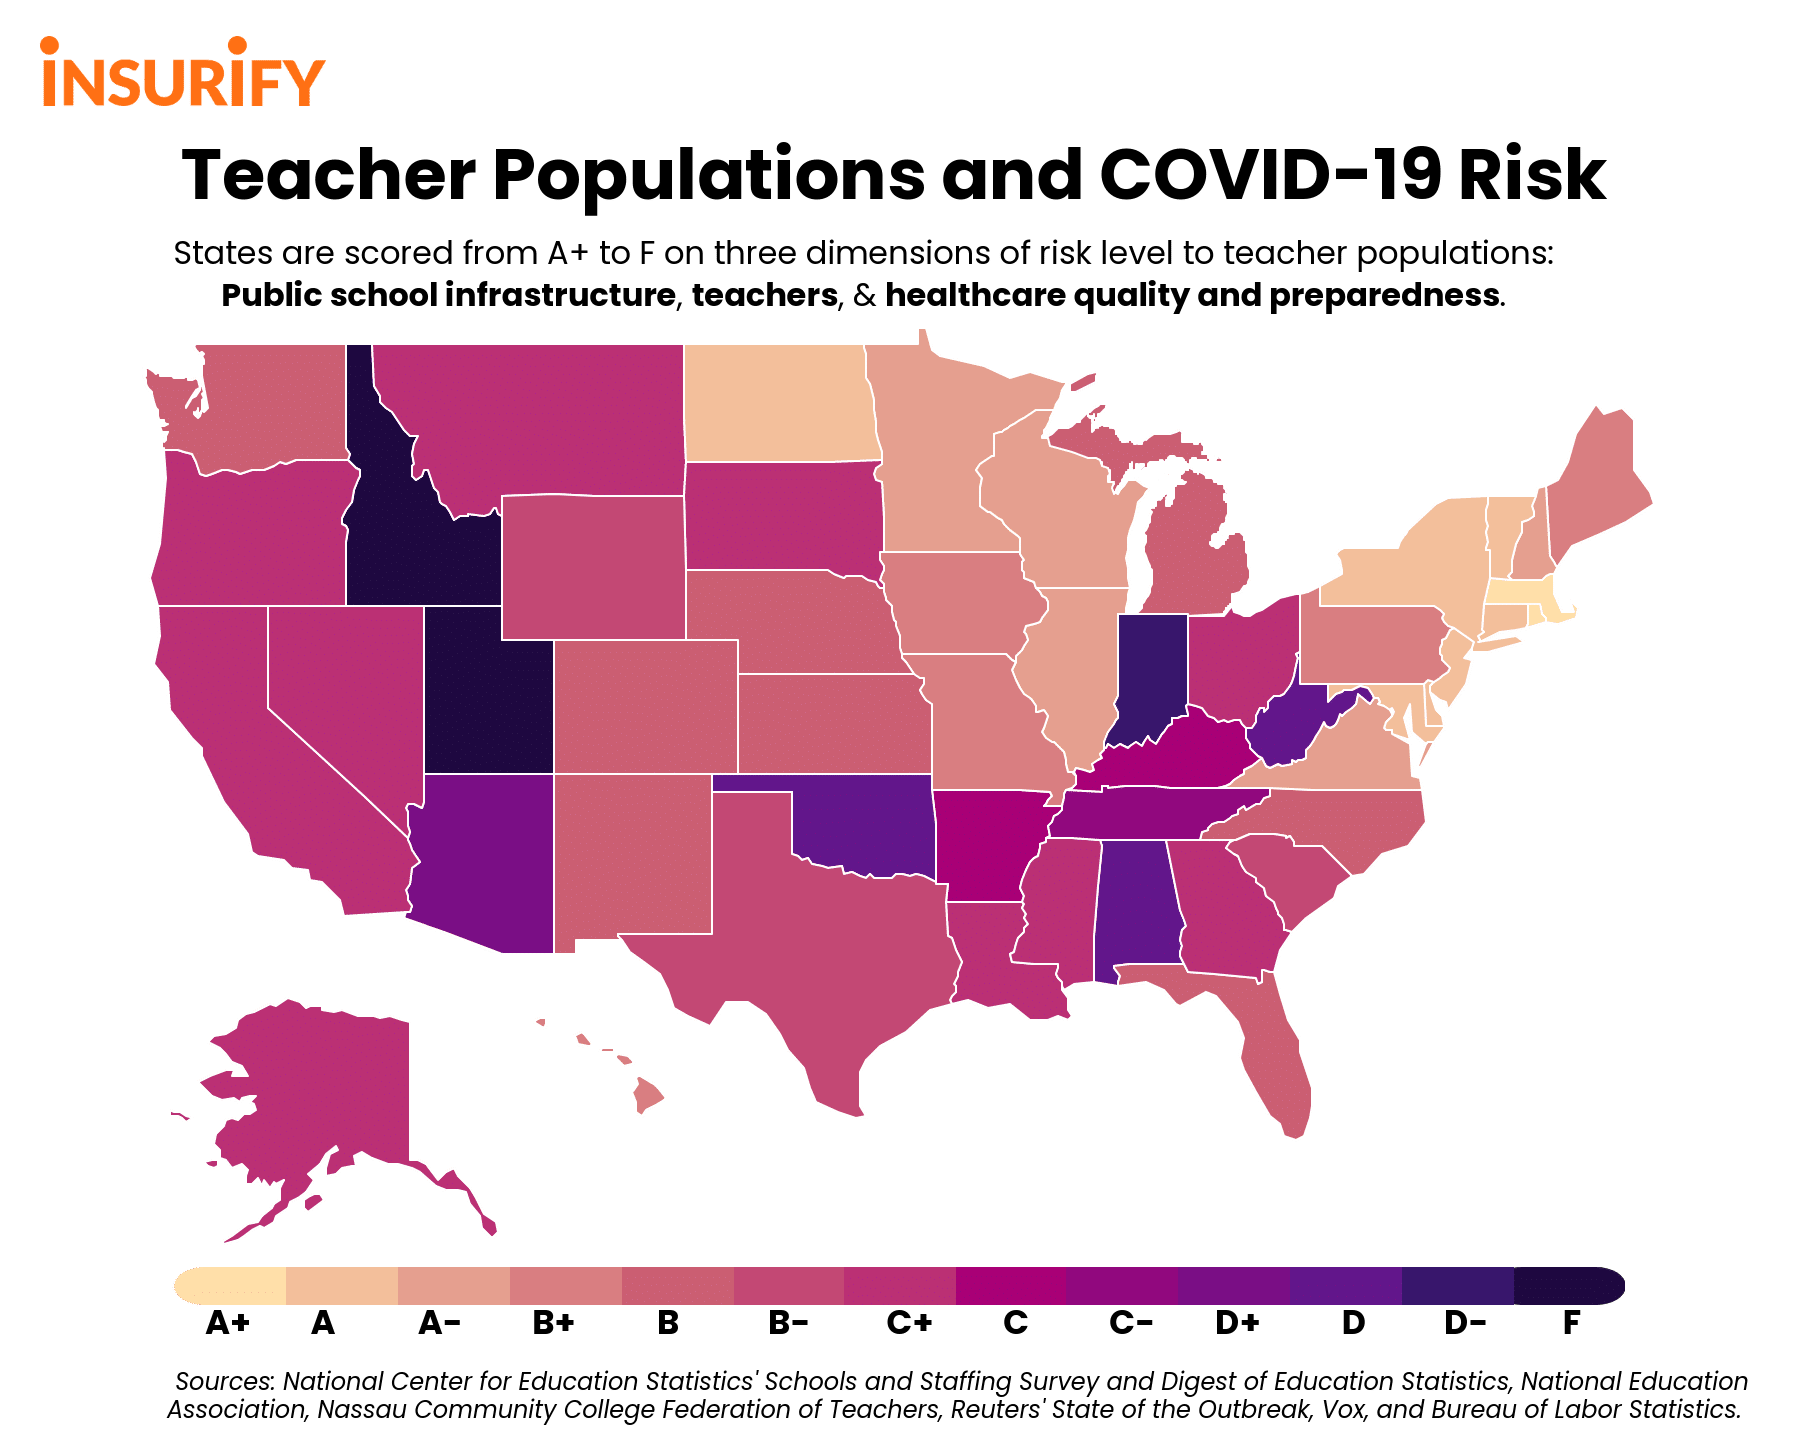
Insurify’s data science team referred to publicly-accessible data to determine the states whose K-12 teacher populations’ health and safety are at the highest risk due to COVID-19 this fall. They evaluated each state across three dimensions: public school infrastructure (school crowding, funding per student), teachers (teacher age, teacher union influence, teacher salary, substitute teacher salary), and healthcare quality and readiness to reopen safely (healthcare quality, recent changes in COVID-19 case counts and death counts, ICU bed availability, COVID-19 testing capacity, and daily COVID-19 cases per capita).
Statistics on school crowding and funding per student were gathered from the National Center for Education Statistics’ latest release of the Digest of Education Statistics. Teacher age data were collected from the National Center of Education Statistics’ Schools and Staffing Survey, while teacher pay data came from the National Education Association. Teacher union data was gathered from the Thomas B. Fordham Institute’s Teacher Union Strength Report. Overall healthcare quality by state was determined using the U.S. News and World Report’s state rankings, which ranked each state on ease of healthcare access, healthcare quality, and public health. Percent changes in COVID-19 case counts and death counts for each state (as of August 21) were retrieved from the State of the Outbreak Report published by Reuters. Data on ICU bed availability, COVID-19 testing capacity, and daily COVID-19 cases per capita were collected from Vox.
Given that a dollar goes further in some states than it does in others (the cost of living varies significantly state by state, due to differences in the price of housing, goods, and services), all salary and funding data in this study were adjusted using the Bureau of Labor Statistics’ regional price parities index.
From these statistics, a weighted composite score out of 100 was calculated for each state. Higher composite scores were indicative of safer states for teachers during the pandemic, while lower composite scores were indicative of states that were less safe for teachers during the pandemic. Each state was then assigned a grade, from A+ to F, based on how its composite score measures up to the national average.
States with the Most At-Risk Teachers to COVID-19
10. Kentucky
- Score: 76 out of 100 (Grade: C)
- Students per teacher: 16.3 (5.1% above the national average)
- Average annual funding per student: $11,197 (9.5% below national average)
Kentucky ranks tenth in the nation for the most vulnerable teacher population to COVID-19. Overall, the teacher population in Kentucky is the youngest on the list and, therefore, least vulnerable. However, case counts in Kentucky remain concerningly high (averaging between 12 and 20 new cases per capita), and over 70 percent of ICU beds in the state are occupied. Kentucky’s healthcare system also ranks 40th out of 50 states. In the event of a spike in cases this fall, the state’s healthcare system may be overwhelmed.
9. Arkansas
- Score: 76 out of 100 (Grade: C)
- Students per teacher: 13.8 (11.0% below the national average)
- Average funding per student, per year: $11,606 (6.2% below the national average)
Arkansas is home to the ninth-most vulnerable teacher population in the nation to COVID-19. Teacher unions are stronger than average in Arkansas, and schools in this state are the least-crowded on this list, with 11 percent fewer students than the national average. Yet, teachers are significantly older than the national average, the state’s healthcare system is the second-worst in the nation, according to the U.S. News and World Report, and more than 60 percent of ICU beds are occupied in Arkansas, as of August 19.
8. Tennessee
- Score: 71 out of 100 (Grade: C-)
- Students per teacher: 15.6 (0.6% above the national average)
- Average funding per student, per year: $9,873 (20.2% below the national average)
Tennessee ranks eighth in the nation for the most at-risk teacher populations to COVID-19 this fall. While school crowding is not as much an issue in this state as it is in others on this list, Tennessee’s healthcare system (ranked 43rd out of 50 states) and school funding are below-average. In fact, Tennessee has already reopened classrooms to K-12 students this school year and has seen the consequences; over 2,000 new cases in children have emerged between August 4 and August 18, according to the Tennessee Department of Health. Additionally, Tennessee has among the highest daily case counts in the country, with over 20 new cases per 100,000 people, as of the latest data regarding case count increases among all ages.
7. Arizona
- Score: 67 out of 100 (Grade: D+)
- Students per teacher: 23.3 (50.2% above the national average)
- Average funding per student, per year: $8,054 (34.9% below the national average)
Arizona ranks seventh in the nation for the most vulnerable teacher population to COVID-19 this fall. Although teacher union influence is relatively strong in Arizona, school crowding is among the worst in the nation, with 50 percent more students per teacher than the national average. Also, daily new cases per 100,000 people in Arizona still land between 12 and 20 each week, and ICU beds are already occupied to over 70 percent of capacity. In the event of a spike in Coronavirus cases when students go back to school this fall, hospitals will be overwhelmed.
6. Oklahoma
- Score: 64 out of 100 (Grade: D)
- Students per teacher: 16.9 (8.9% above the national average)
- Average funding per student, per year: $9,153 (26.1% below the national average)
Oklahoma is home to the sixth-most vulnerable teacher population in the nation, due to a combination of low school funding per capita, above-average rates of school crowding, and below-average healthcare. In fact, healthcare in the Sooner State is ranked among the lowest in the nation (47th out of 50 states), according to the U.S. News and World Report. Additionally, although Oklahoma has seen a two-week drop in cases as of August 19, the daily number of COVID-19 cases per capita in Oklahoma are still higher than in most states, at 12 to 20 new cases per 100,000 people, per day.
5. West Virginia
- Score: 64 out of 100 (Grade: D)
- Students per teacher: 14.1 (9.1% below the national average)
- Average funding per student, per year: $13,011 (5.1% above the national average)
West Virginia rounds out the five states in the nation with the most at-risk teacher population, which is significantly older than the national average. More than 70 percent of ICU beds are occupied in West Virginia as of August 19. Not only this, but according to the U.S. News and World Report, the state has the third-worst healthcare in the nation. The Mountain State is ill-prepared, should a spike in cases arise when the school year begins. Reopening plans vary by county, based on a seven-day average of each county’s daily new case count. Worryingly, according to state guidelines, counties with up to 15 new cases per 100,000 people per day are still permitted to engage in in-person instruction.
4. Alabama
- Score: 63 out of 100 (Grade: D)
- Students per teacher: 17.5 (12.8% above national average)
- Average funding per student, per year: $10,715 (13.4% below the national average)
Alabama has the fourth-most vulnerable teacher population in the country to COVID-19 this fall, due to a combination of below-average teacher union strength, inadequate healthcare resources, and moderate school crowding. In fact, Alabama is the state with the fifth-worst healthcare in America, according to the U.S. News and World Report. Also, ICU beds in the state are already occupied above 70% of capacity, and 10 to 15 percent of COVID-19 tests are coming back positive, among the highest rates in the country.
3. Indiana
- Score: 60 out of 100 (Grade: D-)
- Students per teacher: 17.4 (12.2% above national average)
- Average funding per student, per year: $10,852 (12.3% below national average)
Indiana is home to the third-most vulnerable teacher population to COVID-19. The combination of an above-average student-teacher ratio and an older-than-average teacher population, plus inadequate health resources, put teacher populations at particular risk in this state. In fact, Indiana ranks in the bottom ten states for healthcare quality — as of August 19, ICU beds in Indiana are already filled at 60% to 70% of capacity. This means that in the event of a surge in infections this fall, Indiana’s resources to treat severe cases and save lives will be strained indeed.
2. Idaho
- Score: 59 out of 100 (Grade: F)
- Students per teacher: 18.3 (18.0% above national average)
- Average funding per student, per year: $7,760 (37.3% below the national average)
Idaho has the second-most vulnerable teacher population to COVID-19 this fall. Although recent COVID-19 have dropped somewhat in the state over the past few weeks, Idaho still has among the highest proportion of daily new cases per capita in the nation. In addition, school crowding in this state is also 18 percent higher than average, combined with an older-than-average teacher population; 37.6 percent of teachers in Idaho are over age 50, which is 17 percent higher than the national average. Teachers are also at the mercy of local school districts, who have been left to decide whether to offer in-person instruction, online instruction, or a hybrid of the two.
1. Utah
- Score: 55 out of 100 (Grade: F)
- Students per teacher: 22.9 (47.6% above national average)
- Average funding per student, per year, adjusted: $7,253 (43.4% below the national average)
Utah is the state with the most vulnerable teacher population to COVID-19 this school year. While healthcare quality and accessibility are above-average in the state, as is teacher union strength, dismal rates of school crowding, below-average public school funding, and school reopening plans outweigh these benefits and are putting teachers at the highest risk in the country. In fact, the Beehive State has already seen numerous teacher protests and spikes in resignations this month. With overcrowding already an issue, fewer teachers than usual this fall will put yet another strain on schools.
If you have questions or comments about this article, please contact insights@insurify.com.
More From ESPN Western Colorado